
Real User Monitoring in SAP Cloud ALM
What is Real User Monitoring and what can we do with it?
Real User Monitoring is monitoring application in SAP Cloud ALM for Operations that measures user requests from your managed SAP solutions. The monitored services and systems (cloud-based or on-premise) send monitoring data to SAP Cloud ALM covering performance and usage of user interactions.
The idea is to correlate user interactions and relevant server requests in Real User Monitoring.
Similarly, to Synthetic User Monitoring in SAP Cloud ALM, request executions are rated on historical values.
Real User Monitoring helps understand user’s behavior which is important aspect improving overall user experience. It gives better insight on how often applications are executed and what is the response-time. It can help to identify the actual root cause of performance problems. For example, are the performance problems related to frontend, network, cloud service, or for other backend systems.
The data is correlated for the following features:
- You can identify single requests that show poor performance for a specific user.
- You can review the execution frequency of a specific application or function.
- You can access the request flow and view the analysis that is including all components involved in a request flow execution.
- You can analyze the resource consumption of each subrequest.
- You can customize your request types with personalization features. Filtering options by specific user, user type, timeframe, request name, and request type.
- You can display the values for different request metrics, broken down into different dimensions for many analysis options.
- You can display the most important usage and performance metrics for front-end and back-end request types.
- You can display the request names using the most resources and causing the most critical execution results.
- You can display detailed information about the actions of a user and the corresponding system response in historical order.
- You can display the operating system, the browser, and the device type used by the different users.
Real User Monitoring is designed for customers who like to get transparency regarding end user behavior based on usage data.
What needs to be done to start using Real User Monitoring?
For Prerequisites, you have to connect your subscribed SAP cloud services to your SAP Cloud ALM instance, by setting up the Landscape Management Service.
- Connect Managed Services / Systems
After adding your service to the Landscape Management app, you need to establish a connection between the service and SAP Cloud ALM to collect monitoring data. How this connection is established depends on the individual service type.
2. Activate Real User Monitoring Data Collection
After connecting the managed services and systems, you have to activate the Real User Monitoring data collection for the managed services or systems that use PULL data collection.
You can activate the data collection in the ”Real User Monitoring” application in SAP Cloud ALM launchpad.
First you add relevant service or system to the scope. Then open configuration panel and activate the data collection by switching the slider from “OFF” to “ON”.
What we see in Real User Monitoring?
Overview
Opening the Real User Monitoring application in SAP Cloud ALM Launchpad, Overview and Favorites are displayed.
In the overview, the services selected in the scope are shown in decreasing criticality. The displayed period is determined by the chosen time frame.
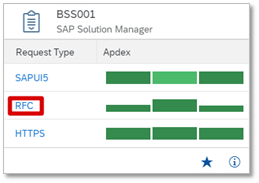
The tile shows the development of the Apdex over time for the three most critical request types of one service; the service name and type are displayed in the tile header. The Apdex (Application Performance Index) is an open standard developed for measuring the performance of applications.
Within a request type, the size of the bar corresponds to the number of executions; the color corresponds to the Apdex rating. In the tooltip, the starting time, the Apdex value, and the number of executions for the different bars are displayed.
Time and Scope selection
Select a Scope

To fill the table where you select the systems and services whose data you want to display, set the desired filter, and select Go. Then select the items from the list and click Apply.

Select a Time Frame

You can define a time frame in the following ways:
- Predefined: Select a predefined display range.
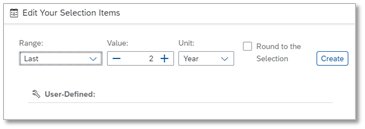
- User-Defined:
- Choose Edit to define a custom display range from the dropdown lists. The time frames that you choose here are saved automatically so that you can access them again later.
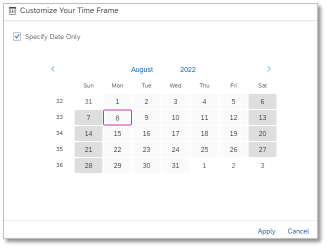
Choose Custom Time Frame to define a start date and a finish date from a calendar. Optionally, you can also specify a particular time on the selected days by unselecting Specify Date Only.
To Navigate to the Request Overview with filtered settings, click on a Request type
Request Overview
The Request Overview provides for the selected time range.
- Application (Fiori ID) or request name (URL for HTTPS)
- Type (SAPUI5, HTTPS, …)
- Number of red executions
- Number of total executions
- Average response time
- Number of distinct users
Click on the Details icon on the right-hand side of a request name to drill down into the following three more levels:
- Request actions depending on the request type.
By choosing the icon in the last column you drilldown and see further details which (user) actions have been executed.


2. Executions during the selected time frame
By choosing the icon in the last column you drilldown and see further details at which timestamps the actions have been executed.
A low value means that most of the time for action is not spent in the selected service but somewhere else. In this case, drill further down to investigate the real issue.
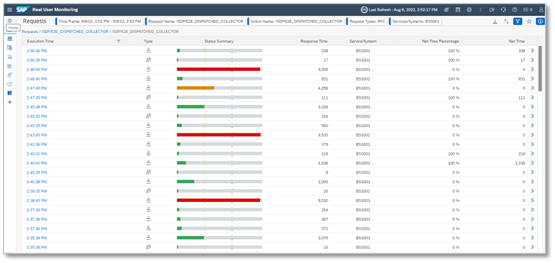
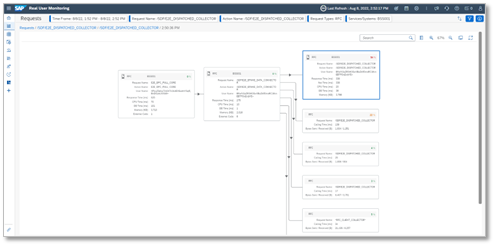
3. Execution Details shows other requests in other components which are triggered by the request.
In the deepest level of the request overview one single execution including correlated requests in other components is displayed. The selected execution has a blue border, other boxes are requests triggered by this action in other cloud services or backend systems.
To display more metrics, select a box and then Node Details.
Analysis View
Analysis View provides flexible selection of metrics and dimensions for analysis and download functionality.
Available metrics:
- E2E Response Time
- Backend Time
- Network Time
- Executions
Dimensions:
- Application/Request Name
- Request Type
- User Name
You define the display settings for this page in the popover Filter.

You have the following options:
- You can set the dimensions to be displayed in the multi-combo box Drilldown. All active dimensions are displayed as table columns. You can change the order of the columns using drag and drop, and you can sort the table by any column using Sort.

- You can select one metric whose values are to be displayed in the select control Metric. For every metric, the following values are displayed:
- Sum – Sum of the metric values of all requests for the displayed drilldown value.
- Average – Average value (Sum divided by Count)
- Count – Number of requests
Frontend Overview
Real User Monitoring in Cloud ALM collects front-end measurements and display these as following types:
- SAPUI5/Fiori
- SAP Web Dynpro
- SAPGUI for HTML (Web GUI)
In section Front End, the following metrics are displayed:
- Executions – Number of executions in the corresponding period
- End User time – The response time from the end user perspective
- Network time – Time spent in the network between front end and server for the roundtrips of the request
- Back-end time – Time spent in the server
You can display the metrics as a Chart or a Table.
You can use Filter to determine the requests, the time frame and the resolution to be displayed.
In section OS & Browsers, the types of the operating systems, browsers, and devices with their number of users are displayed.
Depending on the flag Display Version in the filter settings, the number of users are only broken down into browser and operating system types or into versions.
To display the individual users for the selected operating system or browser, click on an entry of the charts. The user names are hashed to protect the sensitive data if your user does not have the Real User Analyst Sensitive role.
Backend Overview
Real User Monitoring in Cloud ALM collects back-end measurements and display these as following types:
- HTTP(S)
- RFC(S) (only on-premise)
- Dialog (only on-premise)
- Web Service
Summary
Real User Monitoring (RUM) is great tool to evaluate performance and the availability of services and systems.
Application adds value because it gives us overview about performance and usage of monitored systems and services, but also gives us possibility to drilldown into single executions and execution details giving us more detailed information about issues and where they are occurring exactly.
RUM supports the monitoring request executions from different platforms with unified user experience using a common look -and-feel and handling pattern. It makes the tool comfortable and easy to use.
Application itself also contains help topics which contains all the necessary information to use the app. If there are changes or updates inside application, the information about changes we can also see in Help Topics by choosing What’s New section. It makes it easy to follow on updates and changes in application.
RUM gives us possibility to offer better performance and user experience for our customers by showing us where we need improve the systems and services so that users would get best experience, performance and gives us opportunity to make our customers systems and services run seamlessly.